Dirk Scholte

Publications
Below are short summaries of my first-author papers. For a full list of publications, including collaboration papers, see my ADS library. Data products from these papers are available on the data page.
Electron temperature relations and the direct N, O, Ne, S and Ar abundances of 49959 star-forming galaxies in DESI Data Release 2
Scholte et al. (2026) · arXiv:2601.02463 · ADS
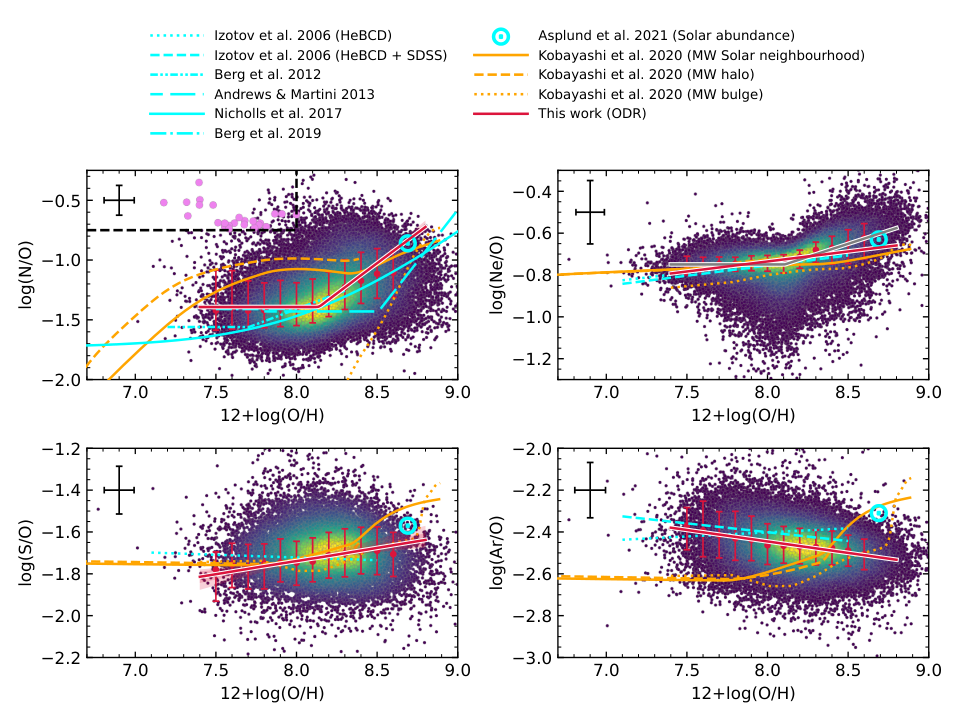
We present the largest catalogue of direct-method chemical abundances to date: nearly 50,000 star-forming galaxies from DESI Data Release 2. By measuring electron temperatures directly, we derive abundances of nitrogen, oxygen, neon, sulphur and argon. The sample includes the two most metal-poor galaxies known in the nearby Universe (about 1% of the solar oxygen abundance) and a rare population of nitrogen-rich, metal-poor galaxies that resemble galaxies seen in the early Universe.
The JWST EXCELS survey: Probing strong-line diagnostics and the chemical evolution of galaxies over cosmic time using Te-metallicities
Scholte et al. (2025), MNRAS, 540, 1800 · arXiv:2502.10499 · ADS
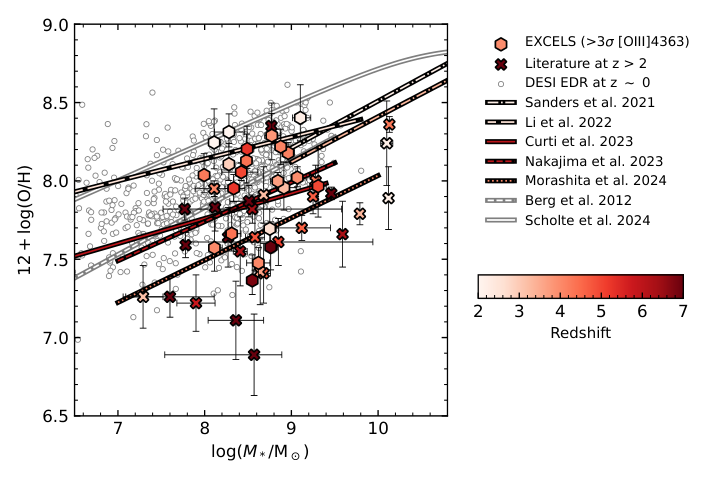
Using JWST/NIRSpec spectra of 22 galaxies at redshifts 1.65–7.9 from the EXCELS survey, together with a local comparison sample from DESI, we test how well common strong-line metallicity diagnostics work in the early Universe. Many calibrations are biased at high redshift because ionisation conditions change over time, but the R̂ diagnostic is largely redshift-independent. We introduce a new neon-based diagnostic, R̂Ne, for galaxies beyond z ≈ 9.5, and find tentative evidence that galaxies at z > 4 deviate from the fundamental metallicity relation.
The atomic gas sequence and mass-metallicity relation from dwarfs to massive galaxies
Scholte et al. (2024) · arXiv:2408.03996 · ADS
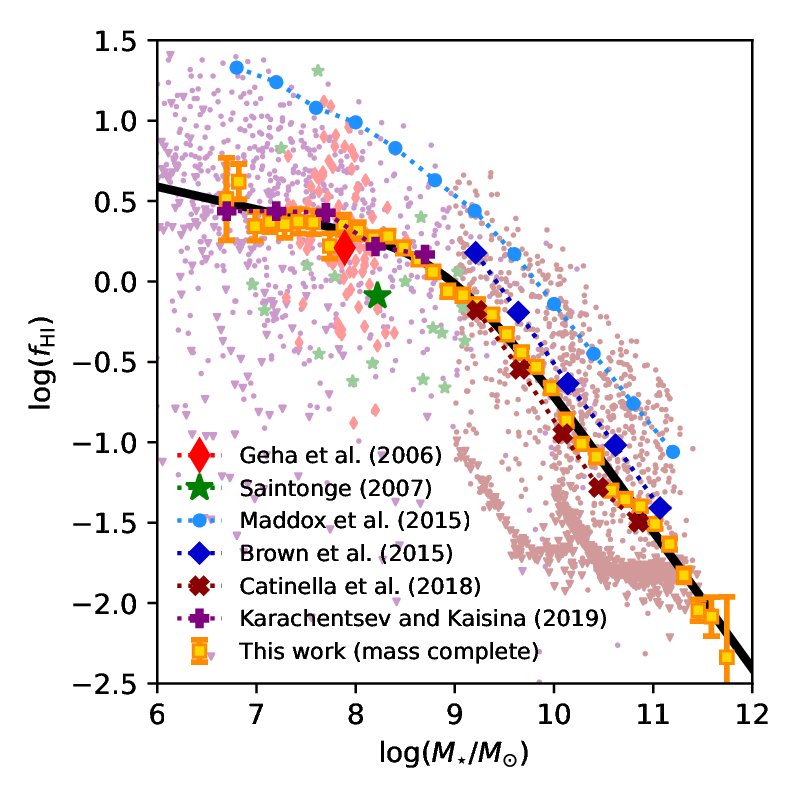
Combining optical spectra from DESI with 21-cm radio observations from ALFALFA, we measure how the atomic gas content and metallicity of galaxies depend on stellar mass across five orders of magnitude, from dwarfs (106.5 M☉) to massive galaxies (1011.5 M☉). The atomic gas sequence changes slope at around 109 M☉, and this change is imprinted on the mass-metallicity relation. This mass scale matches the point below which supernova-driven winds are expected to remove gas efficiently from low-mass galaxies.
Cold gas mass measurements for the era of large optical spectroscopic surveys
Scholte & Saintonge (2023), MNRAS, 518, 353 · arXiv:2210.05683 · ADS
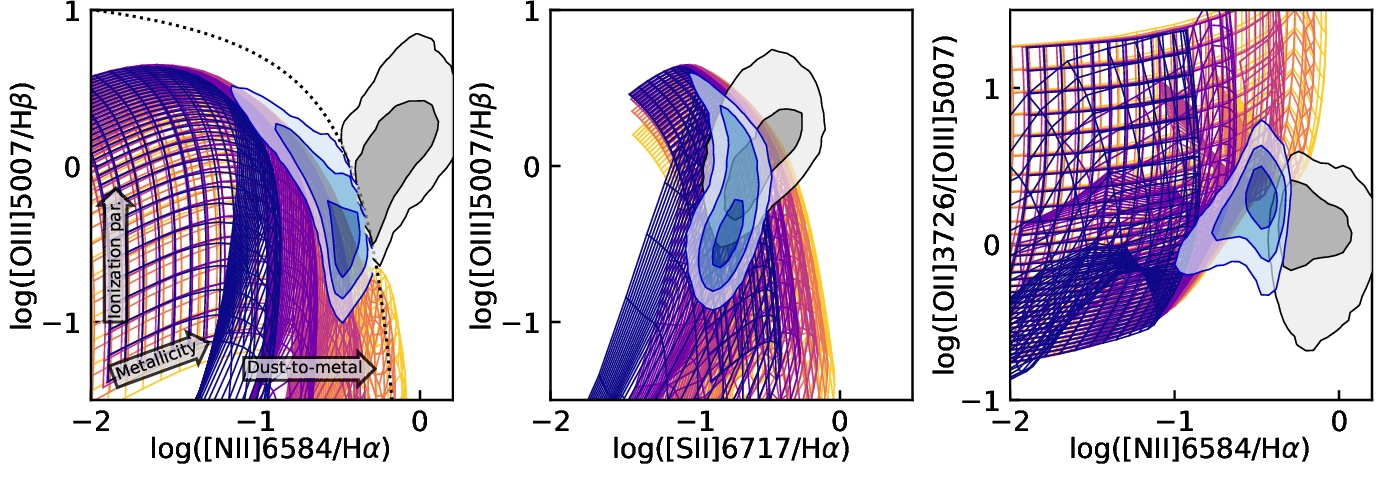
Direct measurements of cold gas are only available for relatively small samples of galaxies. We show how gas masses can instead be estimated from optical emission lines, using photoionization models and simulation-based inference, and calibrate the method against PHANGS-ALMA and xCOLD GASS observations. Applied to SDSS galaxies, these gas masses reduce the scatter in the mass-metallicity relation more than star formation rate does, as predicted by models and simulations.